import sys
sys.path.append("../../")

import os

import uuid
import numpy as np
import geopandas as gpd
import pandas as pd
from shapely import wkt

from geowrangler import dhs
from povertymapping import settings, osm, ookla, nightlights
from povertymapping.dhs import generate_dhs_cluster_level_data
from povertymapping.osm import OsmDataManager
from povertymapping.ookla import OoklaDataManager
import getpass
import pickle

from sklearn.model_selection import train_test_split, KFold, RepeatedKFold
from sklearn.model_selection import GroupKFold, cross_val_predict, cross_val_score, LeaveOneGroupOut
from sklearn.preprocessing import MinMaxScaler
from sklearn.metrics import r2_score
import matplotlib.pyplot as plt
import seaborn as sns

import shapCross Country Model Training (Initial)
%reload_ext autoreload
%autoreload 2
Set up Data Access
# Instantiate data managers for Ookla and OSM
# This auto-caches requested data in RAM, so next fetches of the data are faster.
osm_data_manager = OsmDataManager(cache_dir=settings.ROOT_DIR/"data/data_cache")
ookla_data_manager = OoklaDataManager(cache_dir=settings.ROOT_DIR/"data/data_cache")
# Log-in using EOG credentials
username = os.environ.get('EOG_USER',None)
username = username if username is not None else input('Username?')
password = os.environ.get('EOG_PASSWORD',None)
password = password if password is not None else getpass.getpass('Password?')
# set save_token to True so that access token gets stored in ~/.eog_creds/eog_access_token
access_token = nightlights.get_eog_access_token(username,password, save_token=True)2023-02-01 17:56:42.977 | INFO | povertymapping.nightlights:get_eog_access_token:48 - Saving access_token to ~/.eog_creds/eog_access_token
2023-02-01 17:56:43.004 | INFO | povertymapping.nightlights:get_eog_access_token:56 - Adding access token to environmentt var EOG_ACCESS_TOKENLoad Countries From DHS data
# Set country-specific variables
country_config = {
    'Philippines': {
        'country_osm':'philippines',
        'ookla_year': 2019,
        'nightlights_year' : 2017,
        'country_code': 'ph',
        'dhs_household_dta_path' : settings.DATA_DIR/"dhs/ph/PHHR71DT/PHHR71FL.DTA",
        'dhs_geographic_shp_path' : settings.DATA_DIR/"dhs/ph/PHGE71FL/PHGE71FL.shp"
    },
    'Timor Leste': {
        'country_osm':'east-timor',
        'ookla_year': 2019,
        'nightlights_year' : 2016,
        'country_code': 'tl',
        'dhs_household_dta_path' : settings.DATA_DIR/"dhs/tl/TLHR71DT/TLHR71FL.DTA",
        'dhs_geographic_shp_path' : settings.DATA_DIR/"dhs/tl/TLGE71FL/TLGE71FL.shp"
    },
    'Cambodia': {
        'country_osm':'cambodia',
        'ookla_year': 2019,
        'nightlights_year' : 2014,
        'country_code': 'kh',
        'dhs_household_dta_path' : settings.DATA_DIR/"dhs/kh/KHHR73DT/KHHR73FL.DTA",
        'dhs_geographic_shp_path' : settings.DATA_DIR/"dhs/kh/KHGE71FL/KHGE71FL.shp"
    },
    'Myanmar': {
        'country_osm':'myanmar',
        'ookla_year': 2019,
        'nightlights_year' : 2015,
        'country_code': 'mm',
        'dhs_household_dta_path' : settings.DATA_DIR/"dhs/mm/MMHR71DT/MMHR71FL.DTA",
        'dhs_geographic_shp_path' : settings.DATA_DIR/"dhs/mm/MMGE71FL/MMGE71FL.shp"
    }
}
Combine base features for all four countries
This section creates countries_data (pd.DataFrame) which combines DHS/Ookla/OSM/VIIRS data for all specified countries.
%%time

# Create list of dataframes per country, and list of all columns appearing in DHS columns
country_data_list = []
dhs_columns = ['DHSCLUST']

for country, config in country_config.items():
    print(f'Loading data for {country}')

    # Load the DHS cluster data
    dhs_household_dta_path = config['dhs_household_dta_path']
    dhs_geographic_shp_path = config['dhs_geographic_shp_path']
    country_code = config['country_code']
    dhs_gdf = generate_dhs_cluster_level_data(
        dhs_household_dta_path,
        dhs_geographic_shp_path,
        col_rename_config=country_code,
        convert_geoms_to_bbox=True,
        bbox_size_km = 2.4
    ).reset_index(drop=True)

    dhs_columns = list(set(dhs_columns + list(dhs_gdf.columns)))


    # Generate base features for the dhs dataframe
    country_data = dhs_gdf.copy()
    country_osm = config['country_osm']
    ookla_year = config['ookla_year']
    nightlights_year = config['nightlights_year']

    # Add in OSM features
    country_data = osm.add_osm_poi_features(country_data, country_osm, osm_data_manager)
    country_data = osm.add_osm_road_features(country_data, country_osm, osm_data_manager)

    # Add in Ookla features
    country_data = ookla.add_ookla_features(country_data, 'fixed', ookla_year, ookla_data_manager)
    country_data = ookla.add_ookla_features(country_data, 'mobile', ookla_year, ookla_data_manager)

    # Add in the nighttime lights features
    country_data = nightlights.generate_nightlights_feature(country_data, nightlights_year)

    country_data_list.append(country_data)

# Combine all country data into a single dataframe
countries_data = gpd.GeoDataFrame(pd.concat(country_data_list,ignore_index=True), crs=country_data_list[0].crs)
Loading data for Philippines2023-02-01 17:57:28.523 | INFO | povertymapping.osm:download_osm_country_data:187 - OSM Data: Cached data available for philippines at /home/jc_tm/project_repos/unicef-ai4d-poverty-mapping/notebooks/2023-01-24-dhs-cross-country-experiments/../../data/data_cache/osm/philippines? True
2023-02-01 17:57:28.525 | DEBUG | povertymapping.osm:load_pois:149 - OSM POIs for philippines being loaded from /home/jc_tm/project_repos/unicef-ai4d-poverty-mapping/notebooks/2023-01-24-dhs-cross-country-experiments/../../data/data_cache/osm/philippines/gis_osm_pois_free_1.shp
2023-02-01 17:57:47.606 | INFO | povertymapping.osm:download_osm_country_data:187 - OSM Data: Cached data available for philippines at /home/jc_tm/project_repos/unicef-ai4d-poverty-mapping/notebooks/2023-01-24-dhs-cross-country-experiments/../../data/data_cache/osm/philippines? True
2023-02-01 17:57:47.607 | DEBUG | povertymapping.osm:load_roads:168 - OSM Roads for philippines being loaded from /home/jc_tm/project_repos/unicef-ai4d-poverty-mapping/notebooks/2023-01-24-dhs-cross-country-experiments/../../data/data_cache/osm/philippines/gis_osm_roads_free_1.shp
2023-02-01 17:59:44.713 | DEBUG | povertymapping.ookla:load_type_year_data:68 - Contents of data cache: []
2023-02-01 17:59:44.716 | INFO | povertymapping.ookla:load_type_year_data:83 - Cached data available at /home/jc_tm/project_repos/unicef-ai4d-poverty-mapping/notebooks/2023-01-24-dhs-cross-country-experiments/../../data/data_cache/ookla/processed/2f858b388182d50703550c8ef9d321df.csv? True
2023-02-01 17:59:44.717 | DEBUG | povertymapping.ookla:load_type_year_data:88 - Processed Ookla data for aoi, fixed 2019 (key: 2f858b388182d50703550c8ef9d321df) found in filesystem. Loading in cache.
2023-02-01 17:59:45.673 | DEBUG | povertymapping.ookla:load_type_year_data:68 - Contents of data cache: ['2f858b388182d50703550c8ef9d321df']
2023-02-01 17:59:45.674 | INFO | povertymapping.ookla:load_type_year_data:83 - Cached data available at /home/jc_tm/project_repos/unicef-ai4d-poverty-mapping/notebooks/2023-01-24-dhs-cross-country-experiments/../../data/data_cache/ookla/processed/5a45dc45080a935951e6c2b6c0052b13.csv? True
2023-02-01 17:59:45.675 | DEBUG | povertymapping.ookla:load_type_year_data:88 - Processed Ookla data for aoi, mobile 2019 (key: 5a45dc45080a935951e6c2b6c0052b13) found in filesystem. Loading in cache.
2023-02-01 17:59:46.304 | INFO | povertymapping.nightlights:get_clipped_raster:414 - Retrieving clipped raster file /home/jc_tm/.geowrangler/nightlights/clip/295bf47ce6753c7f06ab79012b769f2a.tifLoading data for Timor Leste2023-02-01 18:00:10.758 | INFO | povertymapping.osm:download_osm_country_data:187 - OSM Data: Cached data available for east-timor at /home/jc_tm/project_repos/unicef-ai4d-poverty-mapping/notebooks/2023-01-24-dhs-cross-country-experiments/../../data/data_cache/osm/east-timor? True
2023-02-01 18:00:10.759 | DEBUG | povertymapping.osm:load_pois:149 - OSM POIs for east-timor being loaded from /home/jc_tm/project_repos/unicef-ai4d-poverty-mapping/notebooks/2023-01-24-dhs-cross-country-experiments/../../data/data_cache/osm/east-timor/gis_osm_pois_free_1.shp
2023-02-01 18:00:12.613 | INFO | povertymapping.osm:download_osm_country_data:187 - OSM Data: Cached data available for east-timor at /home/jc_tm/project_repos/unicef-ai4d-poverty-mapping/notebooks/2023-01-24-dhs-cross-country-experiments/../../data/data_cache/osm/east-timor? True
2023-02-01 18:00:12.615 | DEBUG | povertymapping.osm:load_roads:168 - OSM Roads for east-timor being loaded from /home/jc_tm/project_repos/unicef-ai4d-poverty-mapping/notebooks/2023-01-24-dhs-cross-country-experiments/../../data/data_cache/osm/east-timor/gis_osm_roads_free_1.shp
2023-02-01 18:00:14.292 | DEBUG | povertymapping.ookla:load_type_year_data:68 - Contents of data cache: ['2f858b388182d50703550c8ef9d321df', '5a45dc45080a935951e6c2b6c0052b13']
2023-02-01 18:00:14.305 | INFO | povertymapping.ookla:load_type_year_data:83 - Cached data available at /home/jc_tm/project_repos/unicef-ai4d-poverty-mapping/notebooks/2023-01-24-dhs-cross-country-experiments/../../data/data_cache/ookla/processed/206a0323fa0e80f82339b66d0c859b4a.csv? True
2023-02-01 18:00:14.306 | DEBUG | povertymapping.ookla:load_type_year_data:88 - Processed Ookla data for aoi, fixed 2019 (key: 206a0323fa0e80f82339b66d0c859b4a) found in filesystem. Loading in cache.
2023-02-01 18:00:14.480 | DEBUG | povertymapping.ookla:load_type_year_data:68 - Contents of data cache: ['2f858b388182d50703550c8ef9d321df', '5a45dc45080a935951e6c2b6c0052b13', '206a0323fa0e80f82339b66d0c859b4a']
2023-02-01 18:00:14.481 | INFO | povertymapping.ookla:load_type_year_data:83 - Cached data available at /home/jc_tm/project_repos/unicef-ai4d-poverty-mapping/notebooks/2023-01-24-dhs-cross-country-experiments/../../data/data_cache/ookla/processed/209c2544788b8e2bdf4db4685c50e26d.csv? True
2023-02-01 18:00:14.482 | DEBUG | povertymapping.ookla:load_type_year_data:88 - Processed Ookla data for aoi, mobile 2019 (key: 209c2544788b8e2bdf4db4685c50e26d) found in filesystem. Loading in cache.
2023-02-01 18:00:14.682 | INFO | povertymapping.nightlights:get_clipped_raster:414 - Retrieving clipped raster file /home/jc_tm/.geowrangler/nightlights/clip/b0d0551dd5a67c8eada595334f2655ed.tifLoading data for Cambodia2023-02-01 18:00:25.204 | INFO | povertymapping.osm:download_osm_country_data:187 - OSM Data: Cached data available for cambodia at /home/jc_tm/project_repos/unicef-ai4d-poverty-mapping/notebooks/2023-01-24-dhs-cross-country-experiments/../../data/data_cache/osm/cambodia? True
2023-02-01 18:00:25.205 | DEBUG | povertymapping.osm:load_pois:149 - OSM POIs for cambodia being loaded from /home/jc_tm/project_repos/unicef-ai4d-poverty-mapping/notebooks/2023-01-24-dhs-cross-country-experiments/../../data/data_cache/osm/cambodia/gis_osm_pois_free_1.shp
2023-02-01 18:00:29.028 | INFO | povertymapping.osm:download_osm_country_data:187 - OSM Data: Cached data available for cambodia at /home/jc_tm/project_repos/unicef-ai4d-poverty-mapping/notebooks/2023-01-24-dhs-cross-country-experiments/../../data/data_cache/osm/cambodia? True
2023-02-01 18:00:29.030 | DEBUG | povertymapping.osm:load_roads:168 - OSM Roads for cambodia being loaded from /home/jc_tm/project_repos/unicef-ai4d-poverty-mapping/notebooks/2023-01-24-dhs-cross-country-experiments/../../data/data_cache/osm/cambodia/gis_osm_roads_free_1.shp
2023-02-01 18:00:40.896 | DEBUG | povertymapping.ookla:load_type_year_data:68 - Contents of data cache: ['2f858b388182d50703550c8ef9d321df', '5a45dc45080a935951e6c2b6c0052b13', '206a0323fa0e80f82339b66d0c859b4a', '209c2544788b8e2bdf4db4685c50e26d']
2023-02-01 18:00:40.897 | INFO | povertymapping.ookla:load_type_year_data:83 - Cached data available at /home/jc_tm/project_repos/unicef-ai4d-poverty-mapping/notebooks/2023-01-24-dhs-cross-country-experiments/../../data/data_cache/ookla/processed/37f570ebc130cb44f9dba877fbda74e2.csv? True
2023-02-01 18:00:40.898 | DEBUG | povertymapping.ookla:load_type_year_data:88 - Processed Ookla data for aoi, fixed 2019 (key: 37f570ebc130cb44f9dba877fbda74e2) found in filesystem. Loading in cache.
2023-02-01 18:00:41.164 | DEBUG | povertymapping.ookla:load_type_year_data:68 - Contents of data cache: ['2f858b388182d50703550c8ef9d321df', '5a45dc45080a935951e6c2b6c0052b13', '206a0323fa0e80f82339b66d0c859b4a', '209c2544788b8e2bdf4db4685c50e26d', '37f570ebc130cb44f9dba877fbda74e2']
2023-02-01 18:00:41.165 | INFO | povertymapping.ookla:load_type_year_data:83 - Cached data available at /home/jc_tm/project_repos/unicef-ai4d-poverty-mapping/notebooks/2023-01-24-dhs-cross-country-experiments/../../data/data_cache/ookla/processed/1128a917060f7bb88c0a6260ed457091.csv? True
2023-02-01 18:00:41.166 | DEBUG | povertymapping.ookla:load_type_year_data:88 - Processed Ookla data for aoi, mobile 2019 (key: 1128a917060f7bb88c0a6260ed457091) found in filesystem. Loading in cache.
2023-02-01 18:00:41.429 | INFO | povertymapping.nightlights:get_clipped_raster:414 - Retrieving clipped raster file /home/jc_tm/.geowrangler/nightlights/clip/4791e78094ba7e323fd5814b3f094a84.tifLoading data for Myanmar2023-02-01 18:00:53.404 | INFO | povertymapping.osm:download_osm_country_data:187 - OSM Data: Cached data available for myanmar at /home/jc_tm/project_repos/unicef-ai4d-poverty-mapping/notebooks/2023-01-24-dhs-cross-country-experiments/../../data/data_cache/osm/myanmar? True
2023-02-01 18:00:53.405 | DEBUG | povertymapping.osm:load_pois:149 - OSM POIs for myanmar being loaded from /home/jc_tm/project_repos/unicef-ai4d-poverty-mapping/notebooks/2023-01-24-dhs-cross-country-experiments/../../data/data_cache/osm/myanmar/gis_osm_pois_free_1.shp
2023-02-01 18:00:57.932 | INFO | povertymapping.osm:download_osm_country_data:187 - OSM Data: Cached data available for myanmar at /home/jc_tm/project_repos/unicef-ai4d-poverty-mapping/notebooks/2023-01-24-dhs-cross-country-experiments/../../data/data_cache/osm/myanmar? True
2023-02-01 18:00:57.933 | DEBUG | povertymapping.osm:load_roads:168 - OSM Roads for myanmar being loaded from /home/jc_tm/project_repos/unicef-ai4d-poverty-mapping/notebooks/2023-01-24-dhs-cross-country-experiments/../../data/data_cache/osm/myanmar/gis_osm_roads_free_1.shp
2023-02-01 18:01:25.726 | DEBUG | povertymapping.ookla:load_type_year_data:68 - Contents of data cache: ['2f858b388182d50703550c8ef9d321df', '5a45dc45080a935951e6c2b6c0052b13', '206a0323fa0e80f82339b66d0c859b4a', '209c2544788b8e2bdf4db4685c50e26d', '37f570ebc130cb44f9dba877fbda74e2', '1128a917060f7bb88c0a6260ed457091']
2023-02-01 18:01:25.727 | INFO | povertymapping.ookla:load_type_year_data:83 - Cached data available at /home/jc_tm/project_repos/unicef-ai4d-poverty-mapping/notebooks/2023-01-24-dhs-cross-country-experiments/../../data/data_cache/ookla/processed/d72ec7e4d144b750e1c0950ecad081e0.csv? True
2023-02-01 18:01:25.727 | DEBUG | povertymapping.ookla:load_type_year_data:88 - Processed Ookla data for aoi, fixed 2019 (key: d72ec7e4d144b750e1c0950ecad081e0) found in filesystem. Loading in cache.
2023-02-01 18:01:25.912 | DEBUG | povertymapping.ookla:load_type_year_data:68 - Contents of data cache: ['2f858b388182d50703550c8ef9d321df', '5a45dc45080a935951e6c2b6c0052b13', '206a0323fa0e80f82339b66d0c859b4a', '209c2544788b8e2bdf4db4685c50e26d', '37f570ebc130cb44f9dba877fbda74e2', '1128a917060f7bb88c0a6260ed457091', 'd72ec7e4d144b750e1c0950ecad081e0']
2023-02-01 18:01:25.913 | INFO | povertymapping.ookla:load_type_year_data:83 - Cached data available at /home/jc_tm/project_repos/unicef-ai4d-poverty-mapping/notebooks/2023-01-24-dhs-cross-country-experiments/../../data/data_cache/ookla/processed/2aff65fdf8072457cba0d42873b7a9c2.csv? True
2023-02-01 18:01:25.914 | DEBUG | povertymapping.ookla:load_type_year_data:88 - Processed Ookla data for aoi, mobile 2019 (key: 2aff65fdf8072457cba0d42873b7a9c2) found in filesystem. Loading in cache.
2023-02-01 18:01:26.117 | INFO | povertymapping.nightlights:get_clipped_raster:414 - Retrieving clipped raster file /home/jc_tm/.geowrangler/nightlights/clip/7a58f067614b6685cd9bb62d4d15a249.tifCPU times: user 4min 10s, sys: 19.7 s, total: 4min 29s
Wall time: 4min 44sdhs_columns['DHSREGCO',
'DHSCLUST',
'SOURCE',
'ADM1FIPSNA',
'DHSID',
'CCFIPS',
'ADM1FIPS',
'DHSREGNA',
'ALT_DEM',
'ADM1SALBCO',
'ADM1DHS',
'DHSYEAR',
'Wealth Index',
'DHSCC',
'DATUM',
'ADM1NAME',
'F21',
'URBAN_RURA',
'F22',
'LATNUM',
'geometry',
'ADM1SALBNA',
'F23',
'ALT_GPS',
'LONGNUM']Inspect the combined target country data
countries_data.info()<class 'geopandas.geodataframe.GeoDataFrame'>
RangeIndex: 2720 entries, 0 to 2719
Data columns (total 86 columns):
# Column Non-Null Count Dtype
--- ------ -------------- -----
0 DHSCLUST 2720 non-null int64
1 Wealth Index 2720 non-null float64
2 DHSID 2720 non-null object
3 DHSCC 2720 non-null object
4 DHSYEAR 2720 non-null float64
5 CCFIPS 2720 non-null object
6 ADM1FIPS 2720 non-null object
7 ADM1FIPSNA 2720 non-null object
8 ADM1SALBNA 2720 non-null object
9 ADM1SALBCO 2720 non-null object
10 ADM1DHS 2720 non-null float64
11 ADM1NAME 2720 non-null object
12 DHSREGCO 2720 non-null float64
13 DHSREGNA 2720 non-null object
14 SOURCE 2720 non-null object
15 URBAN_RURA 2720 non-null object
16 LATNUM 2720 non-null float64
17 LONGNUM 2720 non-null float64
18 ALT_GPS 2720 non-null float64
19 ALT_DEM 2720 non-null float64
20 DATUM 2720 non-null object
21 geometry 2720 non-null geometry
22 poi_count 2720 non-null float64
23 atm_count 2720 non-null float64
24 atm_nearest 2720 non-null float64
25 bank_count 2720 non-null float64
26 bank_nearest 2720 non-null float64
27 bus_station_count 2720 non-null float64
28 bus_station_nearest 2720 non-null float64
29 cafe_count 2720 non-null float64
30 cafe_nearest 2720 non-null float64
31 charging_station_count 2720 non-null float64
32 charging_station_nearest 2720 non-null float64
33 courthouse_count 2720 non-null float64
34 courthouse_nearest 2720 non-null float64
35 dentist_count 2720 non-null float64
36 dentist_nearest 2720 non-null float64
37 fast_food_count 2720 non-null float64
38 fast_food_nearest 2720 non-null float64
39 fire_station_count 2720 non-null float64
40 fire_station_nearest 2720 non-null float64
41 food_court_count 2720 non-null float64
42 food_court_nearest 2720 non-null float64
43 fuel_count 2720 non-null float64
44 fuel_nearest 2720 non-null float64
45 hospital_count 2720 non-null float64
46 hospital_nearest 2720 non-null float64
47 library_count 2720 non-null float64
48 library_nearest 2720 non-null float64
49 marketplace_count 2720 non-null float64
50 marketplace_nearest 2720 non-null float64
51 pharmacy_count 2720 non-null float64
52 pharmacy_nearest 2720 non-null float64
53 police_count 2720 non-null float64
54 police_nearest 2720 non-null float64
55 post_box_count 2720 non-null float64
56 post_box_nearest 2720 non-null float64
57 post_office_count 2720 non-null float64
58 post_office_nearest 2720 non-null float64
59 restaurant_count 2720 non-null float64
60 restaurant_nearest 2720 non-null float64
61 social_facility_count 2720 non-null float64
62 social_facility_nearest 2720 non-null float64
63 supermarket_count 2720 non-null float64
64 supermarket_nearest 2720 non-null float64
65 townhall_count 2720 non-null float64
66 townhall_nearest 2720 non-null float64
67 road_count 2720 non-null float64
68 fixed_2019_mean_avg_d_kbps_mean 1443 non-null float64
69 fixed_2019_mean_avg_u_kbps_mean 1443 non-null float64
70 fixed_2019_mean_avg_lat_ms_mean 1443 non-null float64
71 fixed_2019_mean_num_tests_mean 1443 non-null float64
72 fixed_2019_mean_num_devices_mean 1443 non-null float64
73 mobile_2019_mean_avg_d_kbps_mean 1707 non-null float64
74 mobile_2019_mean_avg_u_kbps_mean 1707 non-null float64
75 mobile_2019_mean_avg_lat_ms_mean 1707 non-null float64
76 mobile_2019_mean_num_tests_mean 1707 non-null float64
77 mobile_2019_mean_num_devices_mean 1707 non-null float64
78 avg_rad_min 2720 non-null float64
79 avg_rad_max 2720 non-null float64
80 avg_rad_mean 2720 non-null float64
81 avg_rad_std 2720 non-null float64
82 avg_rad_median 2720 non-null float64
83 F21 0 non-null object
84 F22 0 non-null object
85 F23 0 non-null object
dtypes: float64(69), geometry(1), int64(1), object(15)
memory usage: 1.8+ MBcountries_data.head()| DHSCLUST | Wealth Index | DHSID | DHSCC | DHSYEAR | CCFIPS | ADM1FIPS | ADM1FIPSNA | ADM1SALBNA | ADM1SALBCO | ... | mobile_2019_mean_num_tests_mean | mobile_2019_mean_num_devices_mean | avg_rad_min | avg_rad_max | avg_rad_mean | avg_rad_std | avg_rad_median | F21 | F22 | F23 | |
|---|---|---|---|---|---|---|---|---|---|---|---|---|---|---|---|---|---|---|---|---|---|
| 0 | 1 | -31881.608696 | PH201700000001 | PH | 2017.0 | NULL | NULL | NULL | NULL | NULL | ... | 0.008752 | 0.008752 | 0.226479 | 0.303841 | 0.257313 | 0.020025 | 0.260396 | NaN | NaN | NaN |
| 1 | 2 | -2855.375000 | PH201700000002 | PH | 2017.0 | NULL | NULL | NULL | NULL | NULL | ... | 0.198795 | 0.119334 | 0.261510 | 6.881082 | 1.390439 | 1.719010 | 0.452909 | NaN | NaN | NaN |
| 2 | 3 | -57647.047619 | PH201700000003 | PH | 2017.0 | NULL | NULL | NULL | NULL | NULL | ... | 0.075383 | 0.049202 | 0.224655 | 0.865518 | 0.343708 | 0.146519 | 0.288261 | NaN | NaN | NaN |
| 3 | 4 | -54952.666667 | PH201700000004 | PH | 2017.0 | NULL | NULL | NULL | NULL | NULL | ... | NaN | NaN | 0.203245 | 0.264794 | 0.227876 | 0.016931 | 0.226401 | NaN | NaN | NaN |
| 4 | 6 | -80701.695652 | PH201700000006 | PH | 2017.0 | NULL | NULL | NULL | NULL | NULL | ... | NaN | NaN | 0.232324 | 0.285085 | 0.250609 | 0.012259 | 0.246076 | NaN | NaN | NaN |
5 rows × 86 columns
# Check if DHS CC can be used as a country grouping column
countries_data['DHSCC'].value_counts()
PH 1213
KH 611
TL 455
MM 441
Name: DHSCC, dtype: int64# Explore as a map with first 30 columns in tooltip
countries_data.iloc[:, :30].explore()Make this Notebook Trusted to load map: File -> Trust Notebook
Data Preparation
Split into labels and features
# Set parameters
label_col = 'Wealth Index'
normalize_labels = 'single-country' # False, 'cross-country' or 'single_country'
# normalize_labels = 'cross-country'
# Split train/test data into features and labels
# For labels, we just select the target label column
labels = countries_data[[label_col]]
# For features, drop all columns from the input dhs files
# If you need the cluster data, refer to country_data / country_test
features = countries_data.drop(dhs_columns, axis=1)
features.shape, labels.shape((2720, 61), (2720, 1))Normalize labels
if normalize_labels is not False:
    scaler = MinMaxScaler(feature_range=(0,1))
    if normalize_labels == 'cross-country':
        labels[labels.columns] = scaler.fit_transform(labels)
    elif normalize_labels == 'single-country':
        labels_temp = labels.copy()
        labels_temp['group_col'] = countries_data['DHSCC']
        labels_temp[f'{label_col}_scaled'] = labels_temp.groupby('group_col', group_keys=False)[label_col].apply(lambda x: (x-min(x))/(max(x)-min(x)))
        labels[label_col] = labels_temp[f'{label_col}_scaled']
display(labels)
A value is trying to be set on a copy of a slice from a DataFrame.
Try using .loc[row_indexer,col_indexer] = value instead

See the caveats in the documentation: https://pandas.pydata.org/pandas-docs/stable/user_guide/indexing.html#returning-a-view-versus-a-copy| Wealth Index | |
|---|---|
| 0 | 0.374681 |
| 1 | 0.446489 |
| 2 | 0.310939 |
| 3 | 0.317605 |
| 4 | 0.253904 |
| ... | ... |
| 2715 | 0.593194 |
| 2716 | 0.328432 |
| 2717 | 0.485159 |
| 2718 | 0.398905 |
| 2719 | 0.791023 |
2720 rows × 1 columns
# Clean features
# For now, just impute nans with 0
# TODO: Implement other cleaning steps
features = features.fillna(0)
Base Features List
The features can be subdivided by the source dataset
OSM
<poi type>_count: number of points of interest (POI) of a specified type in that area- ex. atm_count: number of atms in cluster
- poi_count: number of all POIs of all types in cluster
<poi_type>_nearest: distance of nearest POI of the specified type- ex. atm_nearest: distance of nearest ATM from that cluster
- OSM POI types included:
atm,bank,bus_stations,cafe,charging_station,courthouse,dentist(clinic),fast_food,fire_station,food_court,fuel(gas station),hospital,library,marketplace,pharmacy,police,post_box,post_office,restaurant,social_facility,supermarket,townhall,road
Ookla
The network metrics features follow the following name convention:
<type>_<year>_<yearly aggregate>_<network variable>_<cluster aggregate>
- type: kind of network connection measured
- fixed: connection from fixed sources (landline, fiber, etc.)
- mobile: connection from mobile devices
- year: Year of source data
- yearly aggregate: How data was aggregated into yearly data
- Note: Ookla provides data per quarter, so a yearly mean takes the average across 4 quarters
- For this model, we only aggregate by yearly mean
- network variable: network characteristic described
- avg_d_kbps: average download speed in kbps
- avg_u_kbps: average upload speed in kbps
- avg_lat_ms: average latency in ms
- num_devices: number of devices measured
- cluster aggregate: how the data was aggregated per cluster aggregate
- Types: min, mean, max, median, std.
- For this model: only mean is used
- This is calculated using area zonal stats, which weighs the average by the intersection of the Ookla tile with the cluster geometry.
- Types: min, mean, max, median, std.
Ex. fixed_2019_mean_avg_d_kbps_median takes the cluster median of 2019 yearly average download speed.
Nightlights (VIIRS)
All nightlights features are taken as the zonal aggregate of the raster data per cluster
- ex.
avg_rad_mean: cluster mean of the average radiance - aggregations used: min, mean, max, median
features.info()<class 'geopandas.geodataframe.GeoDataFrame'>
RangeIndex: 2720 entries, 0 to 2719
Data columns (total 61 columns):
# Column Non-Null Count Dtype
--- ------ -------------- -----
0 poi_count 2720 non-null float64
1 atm_count 2720 non-null float64
2 atm_nearest 2720 non-null float64
3 bank_count 2720 non-null float64
4 bank_nearest 2720 non-null float64
5 bus_station_count 2720 non-null float64
6 bus_station_nearest 2720 non-null float64
7 cafe_count 2720 non-null float64
8 cafe_nearest 2720 non-null float64
9 charging_station_count 2720 non-null float64
10 charging_station_nearest 2720 non-null float64
11 courthouse_count 2720 non-null float64
12 courthouse_nearest 2720 non-null float64
13 dentist_count 2720 non-null float64
14 dentist_nearest 2720 non-null float64
15 fast_food_count 2720 non-null float64
16 fast_food_nearest 2720 non-null float64
17 fire_station_count 2720 non-null float64
18 fire_station_nearest 2720 non-null float64
19 food_court_count 2720 non-null float64
20 food_court_nearest 2720 non-null float64
21 fuel_count 2720 non-null float64
22 fuel_nearest 2720 non-null float64
23 hospital_count 2720 non-null float64
24 hospital_nearest 2720 non-null float64
25 library_count 2720 non-null float64
26 library_nearest 2720 non-null float64
27 marketplace_count 2720 non-null float64
28 marketplace_nearest 2720 non-null float64
29 pharmacy_count 2720 non-null float64
30 pharmacy_nearest 2720 non-null float64
31 police_count 2720 non-null float64
32 police_nearest 2720 non-null float64
33 post_box_count 2720 non-null float64
34 post_box_nearest 2720 non-null float64
35 post_office_count 2720 non-null float64
36 post_office_nearest 2720 non-null float64
37 restaurant_count 2720 non-null float64
38 restaurant_nearest 2720 non-null float64
39 social_facility_count 2720 non-null float64
40 social_facility_nearest 2720 non-null float64
41 supermarket_count 2720 non-null float64
42 supermarket_nearest 2720 non-null float64
43 townhall_count 2720 non-null float64
44 townhall_nearest 2720 non-null float64
45 road_count 2720 non-null float64
46 fixed_2019_mean_avg_d_kbps_mean 2720 non-null float64
47 fixed_2019_mean_avg_u_kbps_mean 2720 non-null float64
48 fixed_2019_mean_avg_lat_ms_mean 2720 non-null float64
49 fixed_2019_mean_num_tests_mean 2720 non-null float64
50 fixed_2019_mean_num_devices_mean 2720 non-null float64
51 mobile_2019_mean_avg_d_kbps_mean 2720 non-null float64
52 mobile_2019_mean_avg_u_kbps_mean 2720 non-null float64
53 mobile_2019_mean_avg_lat_ms_mean 2720 non-null float64
54 mobile_2019_mean_num_tests_mean 2720 non-null float64
55 mobile_2019_mean_num_devices_mean 2720 non-null float64
56 avg_rad_min 2720 non-null float64
57 avg_rad_max 2720 non-null float64
58 avg_rad_mean 2720 non-null float64
59 avg_rad_std 2720 non-null float64
60 avg_rad_median 2720 non-null float64
dtypes: float64(61)
memory usage: 1.3 MBModel Training
# Set parameters
groupkfold_col = 'DHSCC'
# cv_num_splits = 5
# cv_num_repeats = 5
train_test_seed = 42
test_size = 0.2
Create train/test cross-validation indices
# train_features, test_features, train_labels, test_labels = train_test_split(
#     features, labels, test_size=test_size, random_state=train_test_seed
# )

# Cross validation
print(f"Performing GroupKFold CV with groups based on DHSCC...")
groups = countries_data[groupkfold_col].values
cv = GroupKFold(n_splits = len(set(groups)))

print(cv.split(features, groups=groups))
print(f'Number of splits based on DHSCC unique values: {cv.get_n_splits()}')
Performing GroupKFold CV with groups based on DHSCC...
<generator object _BaseKFold.split at 0x7f389b71d200>
Number of splits based on DHSCC unique values: 4Instantiate model
For now, we will train a simple random forest model
from sklearn.ensemble import RandomForestRegressor
model = RandomForestRegressor(n_estimators=100, random_state=train_test_seed, verbose=0)
modelRandomForestRegressor(random_state=42)In a Jupyter environment, please rerun this cell to show the HTML representation or trust the notebook.
On GitHub, the HTML representation is unable to render, please try loading this page with nbviewer.org.
RandomForestRegressor(random_state=42)
Evaluate model training using cross-validation
We evalute the model’s generalizability when training over different train/test splits
Ideally for R^2
- We want a high mean: This means that we achieve a high model performance over the different train/test splits
- We want a low standard deviation (std): This means that the model performance is stable over multiple training repetitions
split_r2_list = []

for i, (train, test) in enumerate(cv.split(features, labels,groups=groups)):
    print(f'Split# {i+1}')

    # Print info about current split
    train_labels = set(groups[train])
    test_labels = set(groups[test])
    print(f'Train countries (num samples): {train_labels} ({len(train)})')
    print(f'Test countries (num samples): {test_labels} ({len(test)})')

    # Split data into train/test
    X_train = features.values[train]
    X_test = features.values[test]
    y_train = labels.values.ravel()[train]
    y_test = labels.values.ravel()[test]

    # print('Input shapes (X_train, X_test, y_train, y_test): ',np.shape(X_train), np.shape(X_test), np.shape(y_train), np.shape(y_test))

    # Train model and get r2
    model.fit(X_train, y_train)
    split_r2 = r2_score(y_test, model.predict(X_test))
    split_r2_list.append(split_r2)
    print(f'Split r^2: {split_r2} \n')

    # Plot histogram of labels
    fig, ax = plt.subplots(2,1, sharex=True, figsize=(5,4))
    ax[0].hist(y_train)
    ax[0].set_title(f'train countries: {train_labels}')
    ax[1].hist(y_test)
    ax[1].set_title(f'test countries: {test_labels}')
    ax[1].set_xlabel('Wealth Index')
    fig.suptitle(f'Split# {i+1} Labels (model $r^2 = {round(split_r2,2)}$)')
    plt.tight_layout()
    plt.show()

    # Plot scatter plot
    fig, ax = plt.subplots(1,1, figsize=(5,4))
    ax.scatter(y_train, model.predict(X_train), label="train")
    ax.scatter(y_test, model.predict(X_test), label="test")
    ax.plot([0,1],[0,1], transform=ax.transAxes, linestyle='dashed', color='k')
    ax.set_xlabel("True Value")
    ax.set_ylabel("Predicted Value")
    ax.legend()
    fig.suptitle(f'Split#{i+1} (test $r^2 = {round(split_r2,2)}$)')
    plt.tight_layout()
    plt.show()

split_r2_mean = round(np.array(split_r2_list).mean(), 2)
split_r2_std = round(np.array(split_r2_list).std(), 2)
print(f'Mean split r^2  (std): {split_r2_mean} ({split_r2_std})')
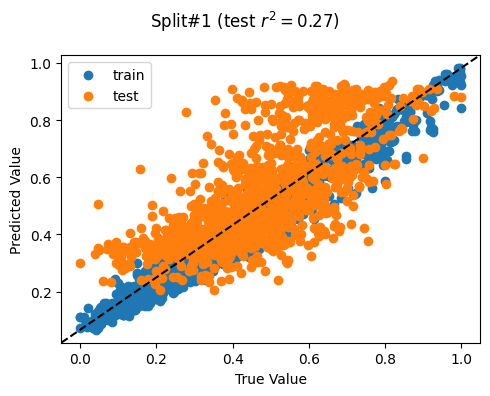
Split# 1
Train countries (num samples): {'TL', 'KH', 'MM'} (1507)
Test countries (num samples): {'PH'} (1213)
Split r^2: 0.2681939802478136

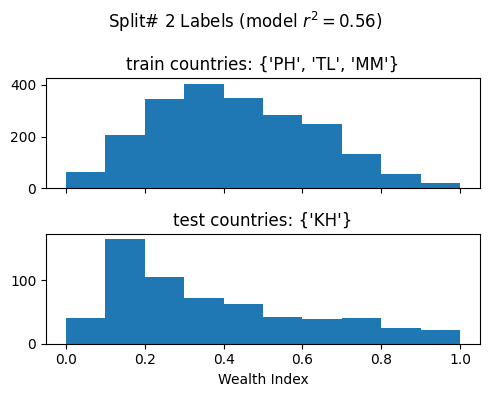
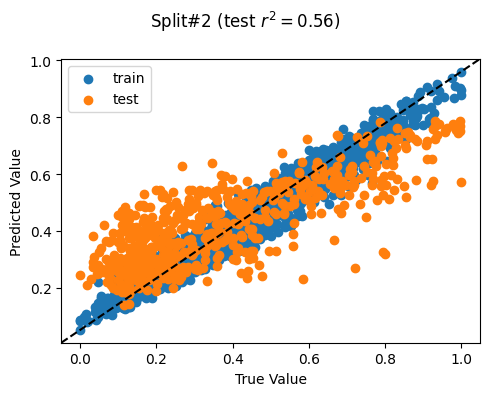
Split# 2
Train countries (num samples): {'PH', 'TL', 'MM'} (2109)
Test countries (num samples): {'KH'} (611)
Split r^2: 0.5620765375311321
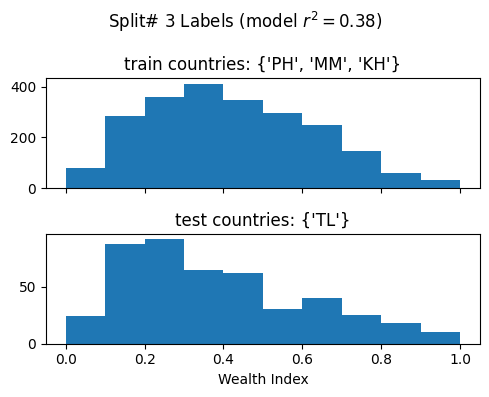
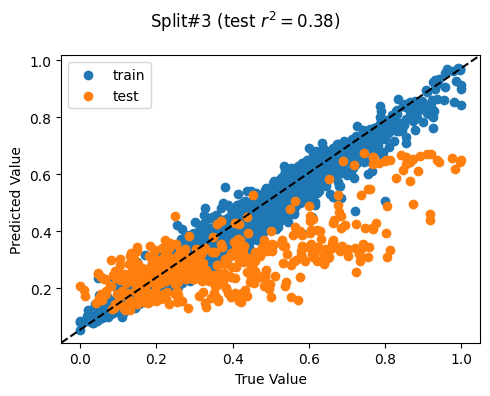
Split# 3
Train countries (num samples): {'PH', 'MM', 'KH'} (2265)
Test countries (num samples): {'TL'} (455)
Split r^2: 0.37906775021315475
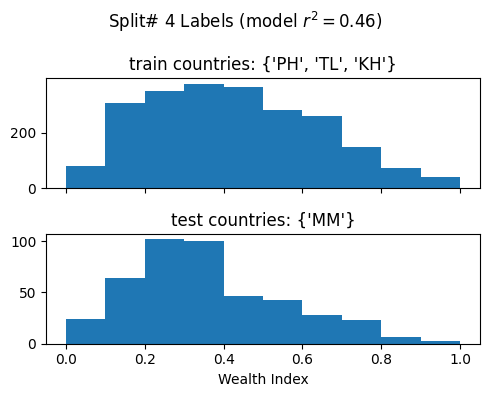
Split# 4
Train countries (num samples): {'PH', 'TL', 'KH'} (2279)
Test countries (num samples): {'MM'} (441)
Split r^2: 0.4558949447788059
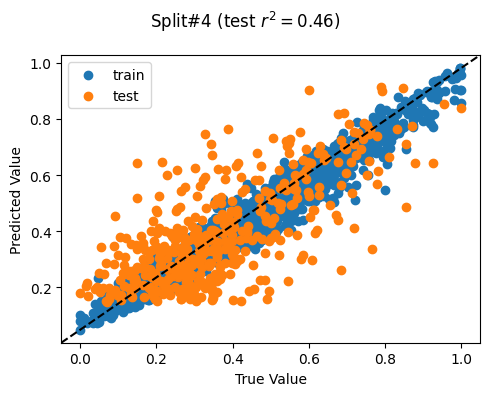
Mean split r^2 (std): 0.42 (0.11)Exploratory Data Analysis
Per-country wealth index
countries_data['Wealth Index'].hist(by=countries_data['DHSCC'], figsize = (4,6),layout=(4,1),  sharex=True, xrot=0, bins=20)
plt.suptitle('Wealth Index')
plt.tight_layout()
plt.show()
Per-country features
features.columnsIndex(['poi_count', 'atm_count', 'atm_nearest', 'bank_count', 'bank_nearest',
'bus_station_count', 'bus_station_nearest', 'cafe_count',
'cafe_nearest', 'charging_station_count', 'charging_station_nearest',
'courthouse_count', 'courthouse_nearest', 'dentist_count',
'dentist_nearest', 'fast_food_count', 'fast_food_nearest',
'fire_station_count', 'fire_station_nearest', 'food_court_count',
'food_court_nearest', 'fuel_count', 'fuel_nearest', 'hospital_count',
'hospital_nearest', 'library_count', 'library_nearest',
'marketplace_count', 'marketplace_nearest', 'pharmacy_count',
'pharmacy_nearest', 'police_count', 'police_nearest', 'post_box_count',
'post_box_nearest', 'post_office_count', 'post_office_nearest',
'restaurant_count', 'restaurant_nearest', 'social_facility_count',
'social_facility_nearest', 'supermarket_count', 'supermarket_nearest',
'townhall_count', 'townhall_nearest', 'road_count',
'fixed_2019_mean_avg_d_kbps_mean', 'fixed_2019_mean_avg_u_kbps_mean',
'fixed_2019_mean_avg_lat_ms_mean', 'fixed_2019_mean_num_tests_mean',
'fixed_2019_mean_num_devices_mean', 'mobile_2019_mean_avg_d_kbps_mean',
'mobile_2019_mean_avg_u_kbps_mean', 'mobile_2019_mean_avg_lat_ms_mean',
'mobile_2019_mean_num_tests_mean', 'mobile_2019_mean_num_devices_mean',
'avg_rad_min', 'avg_rad_max', 'avg_rad_mean', 'avg_rad_std',
'avg_rad_median'],
dtype='object')features_list = [
'avg_rad_mean',
'avg_rad_median',
'fixed_2019_mean_avg_d_kbps_mean',
'fixed_2019_mean_avg_u_kbps_mean',
'fixed_2019_mean_avg_lat_ms_mean',
'fixed_2019_mean_num_tests_mean',
'fixed_2019_mean_num_devices_mean',
'mobile_2019_mean_avg_d_kbps_mean',
'mobile_2019_mean_avg_u_kbps_mean',
'mobile_2019_mean_avg_lat_ms_mean',
'mobile_2019_mean_num_tests_mean',
'mobile_2019_mean_num_devices_mean',
]
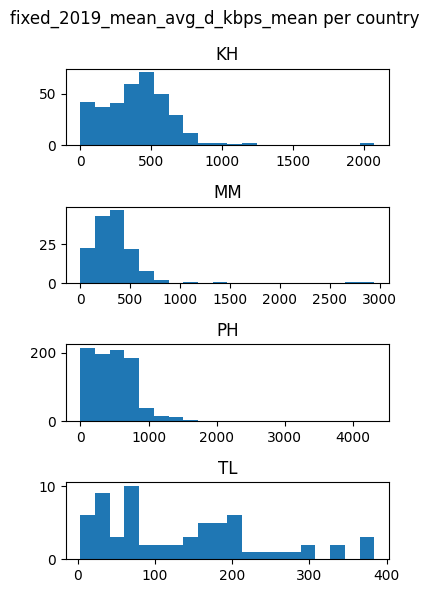
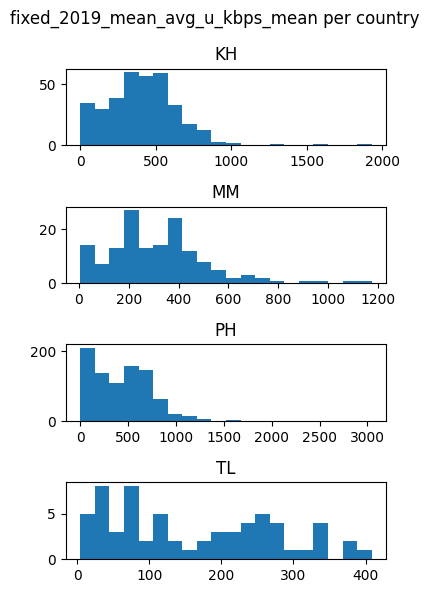
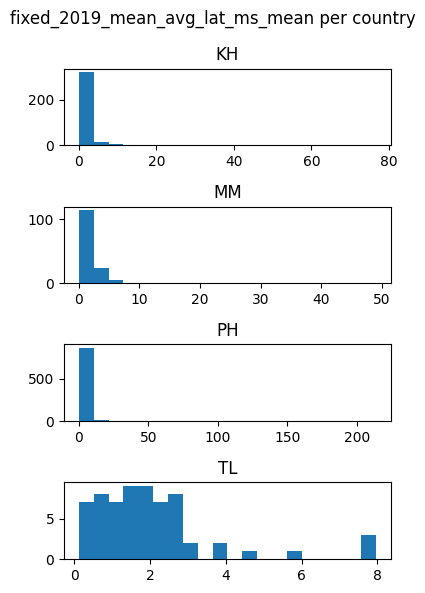
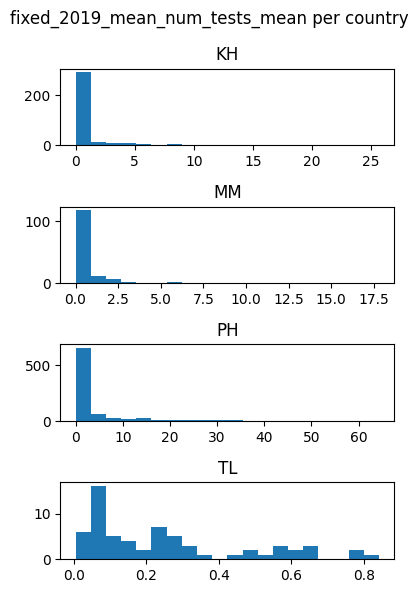
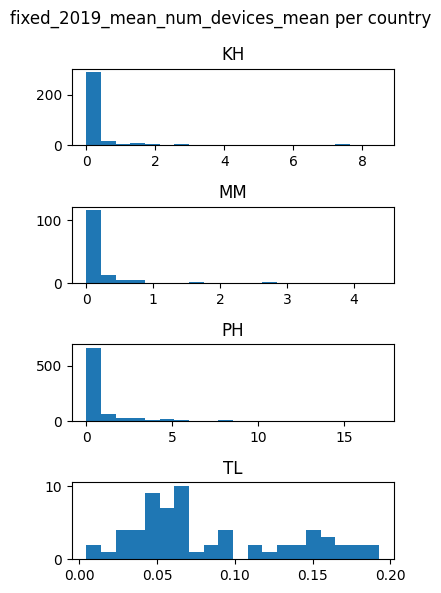
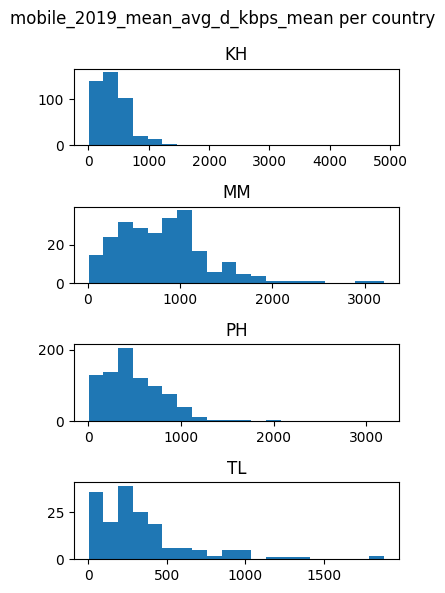
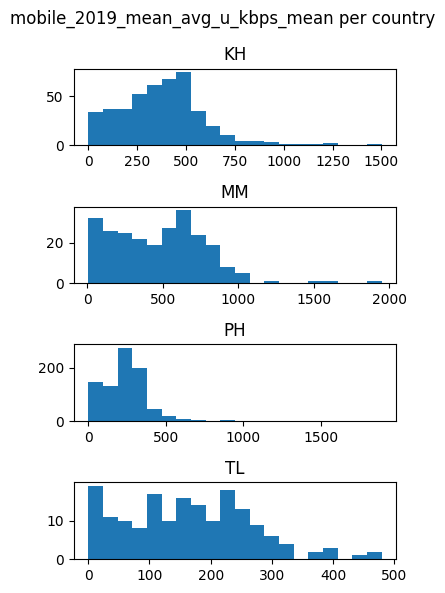
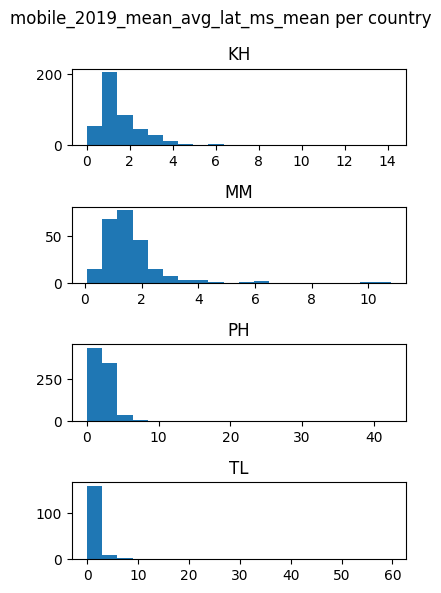
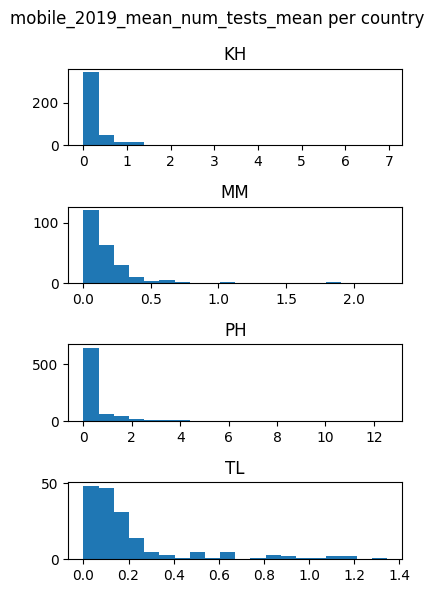
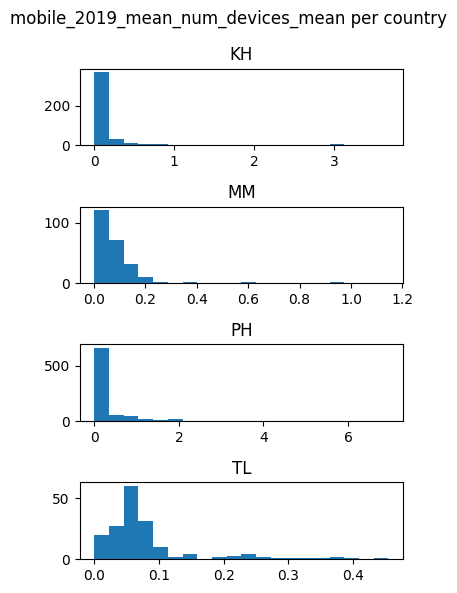
for feature in features_list:
countries_data[feature].hist(by=countries_data['DHSCC'], figsize = (4,6),layout=(4,1), xrot=0, bins=20)
plt.suptitle(f'{feature} per country')
plt.tight_layout()
plt.show()

