Basic insights from the dataset
Overview
Here are some exploratory work that we have produced using the Project CCHAIN dataset.
1. Visualizing precipitation and dengue cases peaks in Dagupan
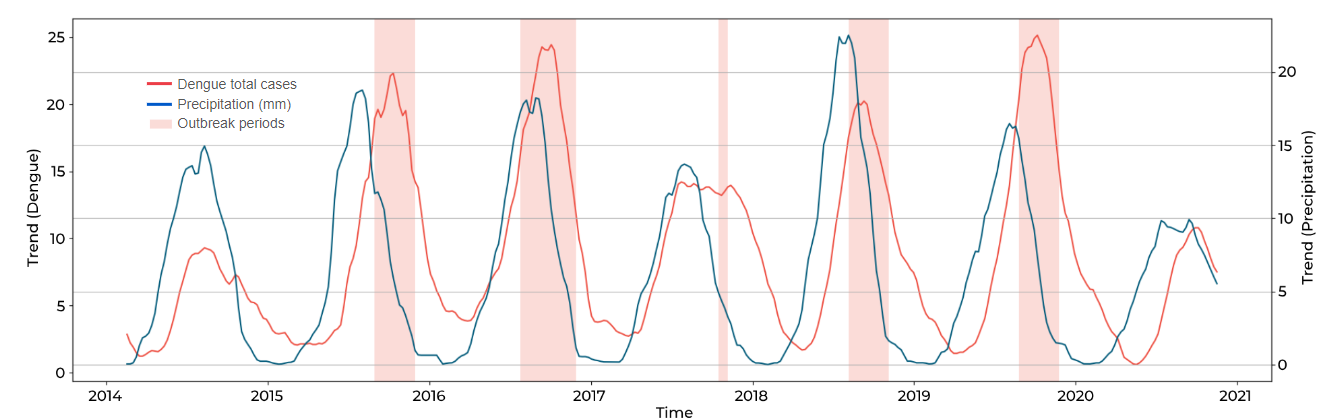
The graph shows a smoothened time series plot of weekly average precipitation (blue), and total dengue cases (red) overlaid with detected outbreak periods (pink shading).
In Dagupan City, which falls within the Type 1 climate zone, rainfall is expected to peak between June to September each year.
We see from the graph that dengue outbreaks typically occur 2-4 weeks after the peak in rainfall, indicating a lag between increased precipitation and the rise in dengue cases. While this pattern is observed, we need more statistical tests to ensure robustness of the results.
2. Comparing households with vulnerable populations in informal settlements
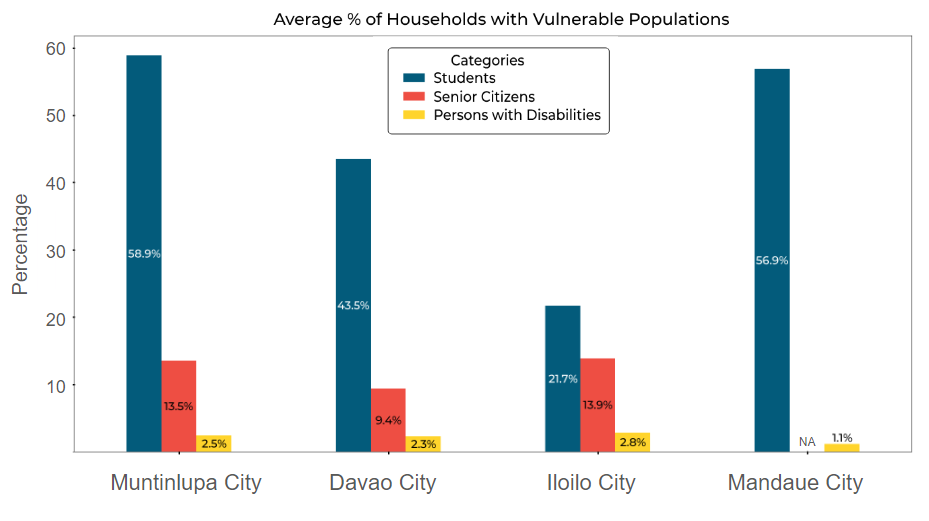
To understand the distribution and needs of vulnerable groups, informal settlement survey asked if there are the followingpopulations in their households: student, senior citizens, and persons with disabilities.
Iloilo City has the least percentage of households with students among the surveyed cities, indicating a potential area of focus for educational outreach and support programs. The lower student presence could reflect demographic trends or migration patterns affecting school-age populations.
Furthermore, there is a slightly higher proportion of senior citizens in Iloilo City compared to other cities. This demographic trend highlights the importance of senior citizen services and healthcare facilities in the area to cater to their specific needs.
We note that Mandaue does not have a recorded percentage of senior citizens because it was one of the earlier surveys conducted, and it was not included in the survey questions.
3. Mapping typhoid and access to water sources in Muntinlupa
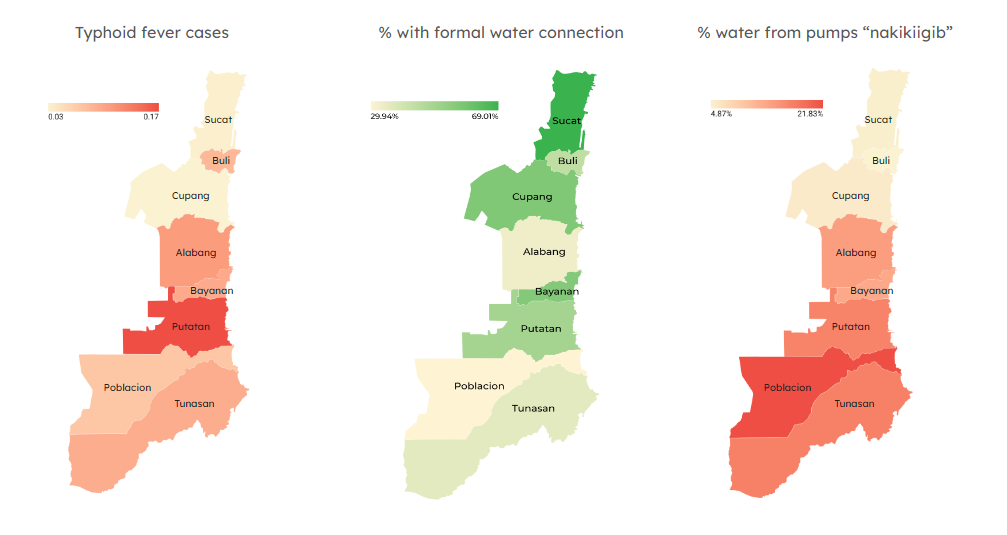
We can also relate disease and socioeconomic factors not just across time, but across space. For example, in Muntinlupa, there are fewer typhoid cases where there is access to formal water sources, highlighting the importance of proper infrastructure.
Conversely, more typhoid cases are observed in areas where water is sourced from pumps (“nakikiigib”), underscoring the health risks associated with inadequate water supply.
These spatial patterns can inform targeted interventions and resource allocation to improve public health outcomes. However, similar to the previous example, we need more statistical tests to ensure the robustness of the results and confirm these observations.
4. Surveying hospital access using 5-min isochrones
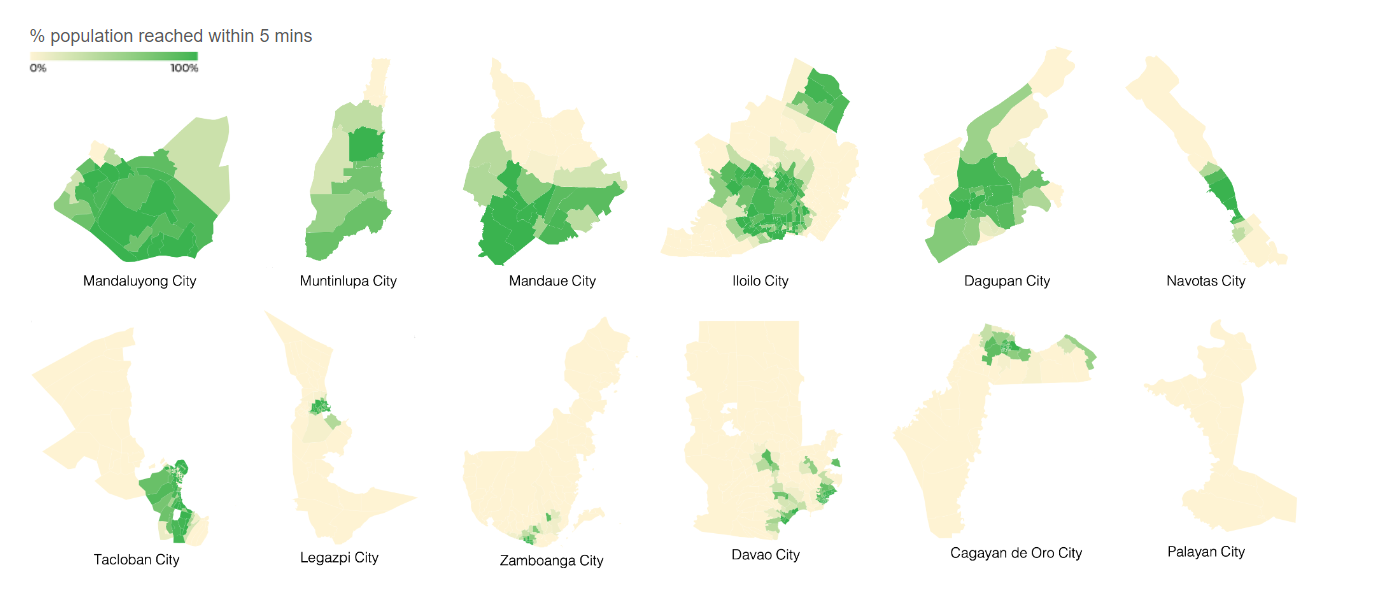
These series of maps for all cities shows how much barangay population can reached within 5 minutes away from a hospital. We define a 5-min isochrone around a hospital as an area that can be reached within a 5-minute travel time, providing a visual representation of hospital accessibility to the city.
In the top row, cities with better access to healthcare tend to be more compact and densely populated. On the other hand, in the bottom row, access to healthcare is often limited to the city center, leaving peripheral areas underserved.
While we can interpret population access to hospitals within the city, we note that the population may opt to go to a nearby city with better facilities, as seen in the case of NCR. This behavior highlights the need for comprehensive regional planning to ensure equitable healthcare access.
Reversing the emphasis towards the provider, we can treat this analysis as a measure of a city LGU’s current capacity to provide accessible healthcare to its constituents. This perspective underscores the importance of local government initiatives in improving healthcare infrastructure within their jurisdiction.