The Project CCHAIN Dataset
Overview
The Project CCHAIN dataset is composed of 29 tables spanning 20 years (2003-2022) and encompassing health, climate, environmental, and socioeconomic variables at the barangay level across 12 Philippine cities (Dagupan, Palayan, Navotas, Mandaluyong, Muntinlupa,Legazpi, Iloilo, Mandaue, Tacloban, Zamboanga, Cagayan de Oro, Davao)
The tables are designed in a way that users can choose variables that are most relevant to their focus city and use case, and link these variables to form a single dataset by merging using standard geography codes and calendar dates. This can be done using the provided linking notebook, or offline using the user’s own code.
Data Licensing
The Project CCHAIN dataset adapted the Creative Commons Attribution 4.0 International (CC BY 4.0) license. This allows anyone to share (copy and redistribute) and adapt (remix, transform, and build upon) a work, as long as they give appropriate credit to the original creator.
However, please note that there are tables with different licenses: - The tm_open_buildings table, follows the Open Database License (ODbL) as directed by its source, OpenStreetMap. Under the ODbL, users are free to use, modify, and distribute the database, but on top of CC BY 4.0’s attribution requirement, this license requires to share any modifications they make under the same ODbL license.
- The survey tables done by PACSII,informal_settlement_community_surveys_v1 and informal_settlement_community_surveys_v2, is under the CC BY-SA 4.0 license, which like ODbL, requires to share any modifications under the same CC BY-SA 4.0 license.
These licenses promote open data principles, fostering collaboration and innovation while ensuring proper acknowledgment and transparency in the use of database resources.
Basics
A central calendar, frequency, as well as the standard geography codes, geometry, area, and distance to coastlines are provided as tables for users.
| Table | Variables |
|---|---|
| calendar | Standard ISO 8601 dates from 2003 to 2022 |
| location | Philippine Standard Geographic Code (PSGC) administrative level identifier data for chosen cities up to barangay (adm4) |
| frequency | Description of update frequency strings |
| disease | list of included climate and disaster sensitive diseases |
| brgy_geography | Barangay total area, distance to coast, geometry |
Health
Disease tables
Disease data came from local and national sources, each focusing on different disease outcomes and temporal resolutions. The tables includes 17 diseases, identified as climate- and disaster-sensitive in the Philippines (Wong et al., 2018, Wong et al., 2022).
All disease data were encoded according to the International Classification of Diseases (ICD-10) and aggregated at the barangay level, ensuring the removal of all personally identifiable information to uphold data privacy.
| ICD-10 code | Disease common name |
|---|---|
| A09.0 | Acute bloody diarrhea |
| B15 | Hepatitis A |
| A00 | Cholera |
| A90-A91 | Dengue fever |
| A27 | Leptospirosis |
| A82 | Rabies |
| A01 | Typhoid fever |
| A08 | Rotaviral enteritis |
| A92 | Chikunguya viral disease |
| E08-E14 | Diabetes |
| I11 | Hypertensive heart disease |
| I21-I22 | Ischemic heart disease |
| I63 | Ischemic stroke |
| A09 | Gastroenteritis |
| J45 | Asthma |
| I20-I25 | Angina |
| T67 | Heat stroke |
1. Department of Health (DOH)
There are two data sources attributed to DOH, namely:
Philippine Integrated Disease Surveillance and Response (PIDSR) - focuses on reporting weekly cases of priority diseases, syndromes, and conditions for surveillance. Cases in this source may be suspected, probable, or confirmed (with a laboratory test).
Field Health Services Information System (FHSIS) - measures the coverage of essential public health services, using physician-diagnosed cases from LGUs’ monthly reports. This data includes disease cases that are diagnosed by a physician, and deaths attributed to the disease.
For both sources, we were able to request both the DOH central level totals and the LGU level reports containing baranggay, age and sex disaggregations.
2. Philippine Statistical Authority (PSA)
The PSA Vital Health Statistics records deaths and their causes through reports from provincial offices.
The following are the tables that contain the disease data:
| Table | Source | Disease Outcome | Spatial Coverage |
|---|---|---|---|
| disease_pidsr_totals | PIDSR-DOH | cases | city |
| disease_psa_totals | PSA | deaths | city |
| disease_fhsis_totals | FHSIS-LGU | cases, deaths | city |
| disease_lgu_disaggregated_totals | FHSIS-LGU, PIDSR-LGU | cases, deaths | city or baranggay |
These tables are made publicly available by Data Use Agreements between Epimetrics and their respective data owners. More details on the disease tables can be found in the extended documentation available here.
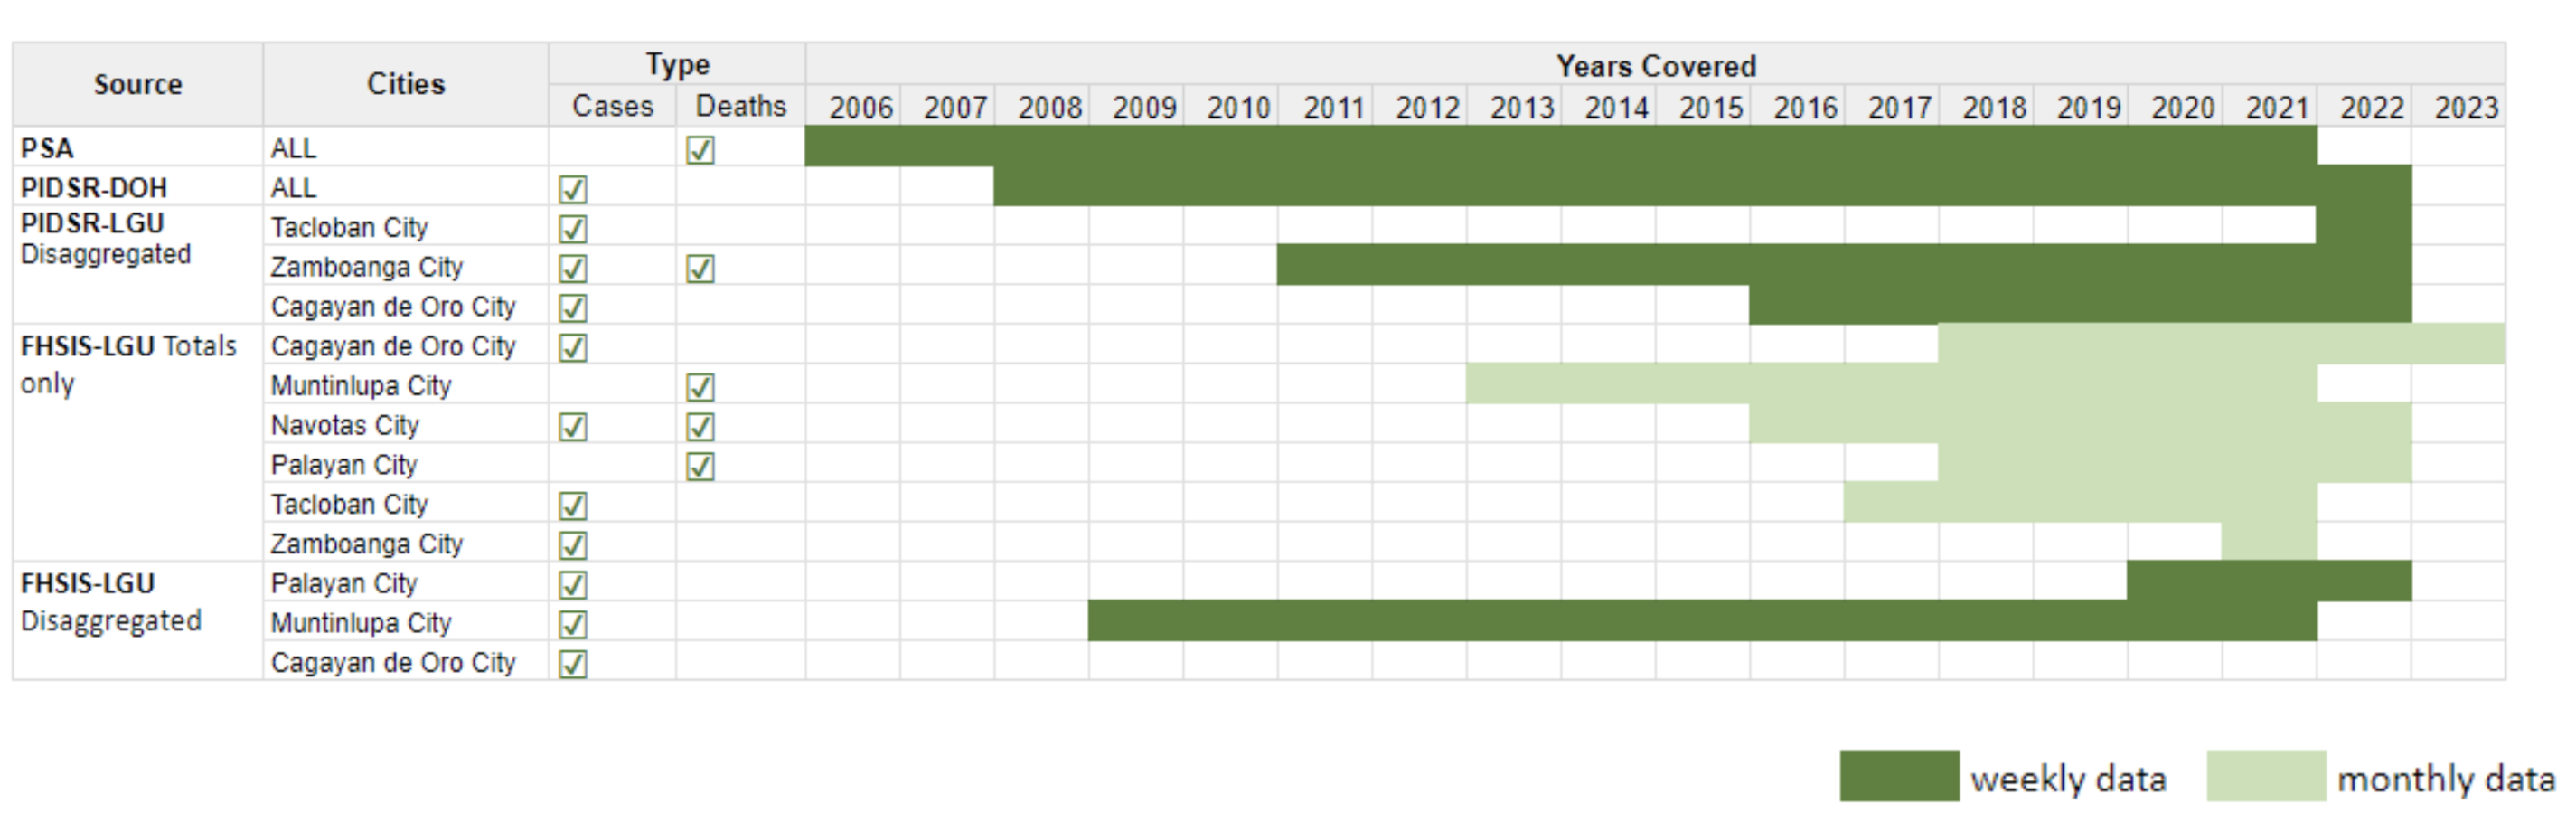
The spatiotemporal coverage and resolution of the disease cases data varies across the cities, and have large data gaps either due to limited availability and legal restrictions. A summary of the available data per source is provided in the figure below.
Climate
The dataset incorporates daily climate variables that have been recognized as significant in disease modeling (Wong et al., 2018). These variables primarily come from publicly available gridded reanalysis datasets, offering the advantages of availability over the daily scale and global spatial coverage. Data is extracted and averaged over all grids covered within the boundaries of each barangay.
| Table | Variables |
|---|---|
| climate_atmosphere | Mean, minimum and maximum temperature, precipitation, heat index, wind speed, relative humidity, solar radiation, UV radiation |
| climate_air_quality | Primary air pollutants (NO2, CO, SO2, ozone), particular matter (PM10, PM2.5) |
| climate_land | Normalized difference vegetation index (NDVI) |
| climate_indices | Percent of Normal Precipitation (PNP), 3- and 6-month standardized precipitation index (SPI6), 30 year monthly normal rainfall (mm) |
| climate_timestep_check | Not part of the dataset, log of hourly timesteps used in aggregating raw climate parameters to daily scale |
More details on the climate tables can be found in the extended documentation available here.
We recognize that the resolution of the (coarse) global gridded data might not be enough for localized studies. In addition to these, we also offer an enhanced version of the mean, minimum, maximum temperature and rainfall produced by our deep learning climate downscaling model, which brought down the spatial resolution from the reanalysis scale (0.25°) to local scale (0.02°).. While we provide the full downscaled output as gridded netcdf files here for all the 12 cities, only those variables that passed our quality checks (QC) are included in this table.
| Table | Variables |
|---|---|
| climate_atmosphere_downscaled | mean, minimum, maximum temperature and rainfall |
Kindly read the documentation before deciding to use this data. If you are uncertain, consider using the climate_atmosphere table instead.
Environment
Land and hazards tables
The dataset also contains variables pertaining to land characteristics and hazards over the chosen cities. The dataset sources are in the form of shapefiles representing categorical variables (hazard level, type of cover), or presence of objects (e.g. buildings). While these sources are high resolution, all are only static and schedule of updates is unspecified.
| Table | Categories |
|---|---|
| esa_worldcover | sparse vegetation, builtup, cropland, grassland, herbaceous_wetland, mangroves, water bodies, shrubland, tree cover |
| google_open_buildings | all buildings, <100sqm buildings, 100-200 sqm buildings, >200sqm buildings |
| project_noah_hazards | [low,medium,high] hazard levels for landslides; flood at 5yr,25yr,100yr return period |
More details on these tables can be found in the extended documentation available here.
Points of interest tables
Data on points of interest (POIs) are also included, and the following were computed based on the POI coordinates: (1) total counts within barangay bounds and (2) distances to barangay centroid. Details on the definitions of the POIs can be viewed in the OpenStreetMap documentation. Additionally, accessibility measure by percent of population reachable at discrete travel times to the nearest health facility (isochrone) for the whole city and per baranggay level are provided using Mapbox Isochrone API.
| Table | POI Categories |
|---|---|
| geoportal_doh_poi_health | health station, rural health unit, hospital, clinic, infirmary, drug abuse treatment rehab center, social hygiene clinic, birthing clinic, medical clinic |
| osm_poi_health | clinic, dentist, doctor, hospital, optician, pharmacy |
| osm_poi_amenity | atm, bank, college, community centre, convenience store, fire station, kindergarten, lighthouse, market place, park, police, school, shelter, supermarket, telephone, town hall, university |
| osm_poi_water_body | wetland, reservoir, water, riverbank, dock, river, stream, canal, drain |
| osm_poi_sanitation | drinking water, water mill, water tower, water works, water well, sanitary dump station, toilet, recycling, waste basket, wastewater, waste transfer station |
| mapbox_health_facility_brgy_isochrones, mapbox_health_facility_city_isochrones | barangay health center, hospital, rural health unit |
The data in the isochrone tables covers 5, 15, and 30 minutes intervals, but for users seeking more granularity, we also provide 15 to 60 minutes isochrone data on a per minute interval separately in this link. More details on these tables can be found in the extended documentation available here.
Socioeconomics
Demography and income indicator tables
The dataset contains population estimates, as well as emerging remote-sensed indicators of development such as nighttime lights, and internet speeds. These data are also aggregated at the barangay level.
| Table | Variables |
|---|---|
| worldpop_population | population count and population density |
| ookla_internet_speed | download and upload speeds, number of devices, latency of both fixed and mobile connections |
| nighttime_lights | cloud-free calibrated nighttime radiance measurements |
| tm_relative_wealth_index | gridded estimates of wealth |
Informal settlement community survey tables
Finally, the dataset also includes household surveys done on partner informal settlement communities in the cities of Muntinlupa, Davao, Iloilo, and Mandaue administered on various dates from 2001 to 2024. These include household level data on various variables on demographics, education, livelihood, transport, DRRM awareness and social aid.
The data is manually encoded from existing paper hardcopies and underwent cleansing to eliminate personally identifiable data and correct encoding inconsistencies.
| Table | Variables |
|---|---|
| informal_settlement_community_surveys_v1 | family composition, occupancy type, occupation, power source, water supply, toilet access, finances |
| informal_settlement_community_surveys_v2 | family composition, occupancy type, occupation, power source, water supply, toilet access, finances, education, tenure, transport, hazard experience, disaster support, diseases experienced, healthcare access |
More details on how these surveys were conducted can be found in the extended documentation available here.
Elements at risk table
A dataset of 12,000 building outlines was also produced by manually annotating buildings over selected 250x250m tiles across the 12 cities. These tiles were carefully selected to focus on residential areas with diverse neighborhood densities, terrains, and levels of urbanization, as well as areas not yet mapped in OpenStreetMap. Each outline was drawn using a combination of visual inspection of satellite imagery, local knowledge, and validation from household survey data to cover all buildings present in the tile.
The attributes contain variables designed to indicate potential wealth markers useful for vulnerability analysis, and can also be used in computer vision models to expand the spatial coverage of the dataset.
Table source: tm_open_buildings
| Building Type | Attributes |
|---|---|
| Settlement - single | roof material, roof layout, roof area, is within gated community |
| Settlement - dense | none, outline drawn over extent of dense neighborhoods with overlapping rooftops |
| Nonsettlement | height |